Non-Food crops

comparison of several non-food crops
So how to compare crops reported in various different units? Well an easy way is to eliminate units by dividing each by a selected base year result, in case by dividing each data set by that set's result for year 2000. Interesting to see how the results paralleled each other in second half of 20 century but have diverged in the 21st century. The recent slump for both cotton and tobacco is particularly noticeable.
(Note that cotton and floriculture trend lines overlap on right side of this chart.)
Apr2018 Update: Continued slump in cotton production for 2017 resulted in major lowering of cotton production forecast.
Sep/2019 Update: Production of these 4 non-food crops now have returned to increasing production, the slump for cotton appears to have ended. Cotton and Tobacco have much slower increases in production than do Floriculture and Natural Rubber.
Leaf Tobacco
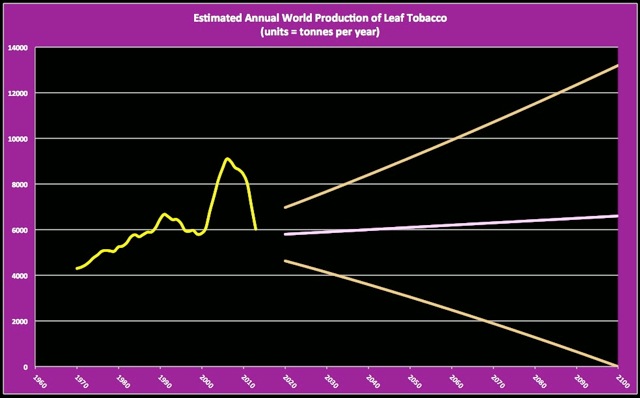 annual world production of tobacco
Tobacco is grown a numerous countries, especially in the developing world and in China. With regard to sustainability, tobacco crops require significant water, heavy fertilization, and extensive use of pesticides. For developing countries other associated issues are child labour, and deforestation to produce wood to fuel curing of the tobacco.
Looking at the trend chart of smoothed data, tobacco production shows a long term upward trend followed by a temporary decline, followed by a significant upward surge and followed in turn by a second decline. The revised forecast model suggests return to long term increasing production.
2019 Update: 2019 model based on 1960-2018 data suggests return to increasing future production of leaf tobacco. This reverses previous forecast of slow decline in production.
Cotton

world production of cotton
Cotton reportedly uses more insecticide than any other crop, has significant water and fertilizer demands, and sometimes is associated with negative impacts to soil fertility and to species diversity. On the positive side, in addition to cotton fibre, cotton provides oil used in food, plus seed hulls and meal, both which are used as animal feed.
The trend chart shows cotton production significantly increased from 1960 through 2010 and continues to increase but at a slower rate.
Sep. 2019 Update: Forecast has moved from flat to steady slow increase.
The trend chart shows cotton production significantly increased from 1960 through 2010 and continues to increase but at a slower rate.
Sep. 2019 Update: Forecast has moved from flat to steady slow increase.
Floriculture

Estimated World Floriculture Production Relative to Year 2000
Floriculture is that portion of horticulture focused on the cultivation of ornamental plants,,cut flowers, ornamental foliage and flower bulbs. Floriculture generally has limited land area requirements but is viewed as having limited sustainability due to heavy dependance on fossil fuels, water, and pesticides. Nonetheless, the industry is making some effort to standardize more sustainable practices. Floriculture also has some history of spreading invasive species such as Japanese knotweed, though I view that more as a past problem.
According to my chart of smoothed estimates of horticulture production relative to year 2000 shows production has more than tripled since 1960, and is forecast to continue increasing.
Apr/18 Update: 2017 production exceeded last year's forecast (though within uncertainty ok) and therefore the global model forecast reset upwards.
Sep/19: Again 2018 production exceeded that for the previous year & again my global forecast model was reset upwards.
Natural Rubber

world production of natural rubber
Natural rubber is harvested primarily as latex, a white sticky liquid collected from certain trees. The latex than is refined into natural rubber, which has many uses due to its resilience, stretching and water proofing properties. Rubber plantations are viewed as having significant social-economic impacts as well as severe impacts to biodiversity. The industry is in early stages of implementing sustainability standards to mitigate such impacts -- touch wood!
World production records go back to the 19th century but I have chosen just to chart estimates since 1960. Per my usual habit I my trend charts utilize moving averaged data to smooth out year to year variations so as to highlight the underlying trend pattern. I should note that rubber does have large year to year variations obscured by this smoothing. Note that production of natural rubber has increased nearly 7-fold since 1960.
Apr. 2018 Update: Changed to moving average to remove noise. 2017 showed record high production of natural rubber, with strong recovery from problems of 2015. Reportedly production somewhat exceeded consumption. Forecast model shows continuing increases in production but with wider uncertainty.
Sep.2019 Update: 2018 again showed record high production of natural rubber. The forecast model suggests this strong increase in production seems likely to continue for many decades.
