greenhouse atmospheric gases
Greenhouse gases are those constituents of our atmosphere that absorb and re-emit infrared light energy, thereby limiting escape of reflected sunlight into space. Nitrogen, oxygen and argon all are non-greenhouse gases since they minimally absorb infrared light. Water vapour, ozone, carbon monoxide and hydrogen chloride all are greenhouse gases since they do absorb infrared, but thee gases are seldom discussed since their residence time is the atmosphere is short (hours to days, as compared to years to centuries for other greenhouse gases). Note that human activity little influences water vapour levels on a global scale by discharge of water vapour, but does significantly increase water vapour levels indirectly via discharge of other emissions that raise global temperature, since water vapour concentration increased with temperature.
That leaves carbon dioxide, methane and nitrous oxide as the three greenhouse gases of primary interest. All three are significant greenhouse gases, atmospheric concentrations of all three are significantly increased by direct human activity, and all three reside in the atmosphere for long periods of time. Additionally there is quite a 'soup' of various trace gases in ppt (parts per trillion) concentrations or lower. Many of the measurable trace gases are artificial halocarbons, which are fairly inert, can accumulate since they have very long residence times, and are very potent greenhouse gases (i.e. efficient in absorbing infrared energy).
There is considerable concern that most of the gases that are potent greenhouse gases in the troposphere also are seriously depleting the ozone layer in the stratosphere. The ozone layer protects life by blocking UV. Early focus of this concern focused on halogenated alkanes, which now have been reduced by international agreement, termed the Montreal Protocol. However rising levels of carbon dioxide, methane, and nitrous oxide also may impact ozone depletion.
Note: For atmospheric measurements units such as ppm, ppb, ppt refer to mole fraction in dry air. Also ppt refers to parts per trillion, not parts per thousand.
Atmospheric Concentration of Carbon Dioxide

atmospheric carbon dioxide
An internet search on the topic of atmospheric carbon dioxide (CO2) will show numerous articles and graphs, indicating great interest. Much of this interest stems from scientific association of increasing atmospheric CO2 concentrations with increasing global temperatures. (Such discussions go back to the late 19th century work of Arrhenius.) Recent decades have seen scientists broaden global warming from CO2 to the wider concept of climate change resulting from a variety of greenhouse gases. Recent decades have also seen wider recognition of the increasingly severe negative impacts of climate change.
The above chart show estimates of atmospheric concentration of CO2 smoothed to eliminate the noise of seasonal variation (i.e. to remove the saw-tooth appearance). This chart is based on recent average atmospheric measurements merged with data from ice core results to extend the trend back to 1750. As for most my charts, the yellow lines indicate the historical trends, the pink lines my model's forecast as to future levels, and the orange lines the uncertainty around my forecasts. In spite of increasing international recognition of climate change problems, the trend line shows levels of carbon dioxide continue to accelerate not decelerate.
Bad News: atmospheric concentrations of CO2 continue to increase faster every year!
Feb 2017 update: 2016 data show steady increasing acceleration in atmospheric levels of carbon dioxide consistent with long term trend line.
May 2018 Update: 2017>2016>2015 consistent with previous (2015) model forecasting increasingly more rapid increase in atmospheric CO2.
Sep. 2019 Update: Atmospheric CO2 levels continue strong year to year increase -- 2019>2018>2017>2016>2015. If inadequate action continues, atmospheric CO2 levels will more than double well before year 2200!!!
Sep. 2020 Update: Atmospheric CO2 continues forecast increase. Atmospheric CO2 levels continue strong year to year increase: 2020>2019>2018 etc.
Comparison of 2000 and 2016 models for atmospheric CO2

comparison of 2000 model to 2016 model for atmospheric carbon dioxide
My first forecast model for atmospheric CO2 was prepared in 2000. I thought it would be a good idea to add it to my present forecast chart for comparison. The above chart essentially is my present chart for CO2 but with a second line (blue & marked) which is my old forecast made in 2000. First the good news -- the 2000 forecast matches the real results for 2000-2020 rather well. Now the bad news -- the 2020 forecast line falls higher than the 2000 forecast, indicating matters are worsening more rapidly than expected in 2000. Still, both forecasts did fall within the 2020 uncertainty estimates.
Atmospheric methane gas

atmospheric methane
Atmospheric methane is many times more potent a greenhouse gas than carbon dioxide but is present in the atmosphere in lower concentrations (ppb rather than ppm). My trend charts show the atmospheric level of methane has greatly increased since 1750, the rate of increase accelerating through the 20th century. Note the unusual surge in methane for several years circa 1950-90, though levels continued to increase thereafter. Recent (i.e. past decade) data suggest methane levels once again have begun to surge.
Sources of methane include release from frozen environments as they melt, emission from forest fires, emissions from fossil fuel extraction, transportation of fossil fuels, and production by microbes in organic rich environments such as swamps, sewage treatment plants, rice paddies, organic waste landfills, or the guts of termites or ruminant animals. For further information see useful introductory articles by Wikipedia or US EPA.
Feb/17 Update: 2016 data confirm previous suggestion that methane levels re once again begining to surge.
May2018 Update: Upward surge in atmospheric methane continues.
Sep24/19 Update: 2019 averaged data right on previous forecasts. Upward surge continues. Model forecast remains unchanged except lower uncertainty estimate raised. Note we soon will triple pre-industrial levels for this potent greenhouse gas.
Oct2/20: 2020 data to date continues on previous forecast. Forecast model unchanged.
ATMOSPHERIC nitrous oxide GAS

atmospheric nitrous oxide
Nitrous oxide, N2O is a greenhouse gas roughly 300 times more potent than carbon dioxide and roughly 10 times more potent than methane in warming potential re global warming. Note however than both nitrous oxide and methane are present in the atmosphere at ppb levels whereas carbon dioxide is present in ppm concentrations. Also note that nitrous oxide can react with and thus deplete atmospheric ozone.
Nitrous oxide is produced (and removed) by microbial action, is emitted by some industrial processes, can be released from nitrogen fertilizers, but especially is released by combustion of fossil fuels and burning of biomass.
Feb 2017 update: 2016 data show steady increasing acceleration in atmospheric levels of nitrous oxide consistent with long term trend line.
May 2018 Update: ditto for 2017 data.
Sep 2019 Update: Steady increasing atmospheric concentrations of nitrous oxide continues right on previous forecast.
Oct 2020: ditto for 2020 todate.
Comparison of greenhouse gases

atmospheric methane and nitrous oxide gases

atmospheric carbon dioxide, methane, and nitrous oxide gases
Excluding water vapour and ozone, the top 3 greenhouses gases are carbon dioxide, methane and nitrous oxide. On one hand, methane is considered some 30 times more potent than carbon dioxide when it comes to long term climate change, and nitrous oxide some 300 times more potent. On the other hand, methane and nitrous oxide are present in ppb levels, whereas carbon dioxide is present in ppm levels. A log scale was necessary to show the 3 gases on one understandable chart.
The first chart above shows atmospheric concentrations for just methane and nitrous oxide. Note methane is increasing more irregularly and more rapidly than nitrous oxide. The second chart includes carbon dioxide, and shows all 3 gases have increased in recent decades, though the trends are somewhat obscured by the compression due to use of a log scale.
Oct. 2020 Update: All 3 greenhouse gases continue forecast annual increases. Note surge in methane associated with natural gas 'gold rush'.
TrACE ATMOSPHERIC GREENHOUSE GASES

trace atmospheric greenhouse gases
These 5 trace gases are potent greenhouse gases. Each substance is charted and discussed individually. CCl4, CFC-11, CFC-12, and CFC-113 all are potent ozone depleting in the stratosphere, and therefore all are regulated by international agreement. However SF6 presently is not viewed as ozone depleting and therefore is less regulated. Since SF6 is some 24000 times as potent a greenhouse gas as CO2, the rapid concentration rise for SF6 is concerning.
May 2018 Forecast: 2017 data right on forecast for all, except CCl4 fell less than expected. This year's CCl4 forecast revised slightly upward.
Oct2020 Update: All trace GHG pretty well on track ok for 2019 and 2020; minor adjustments made to forecast model.
May 2018 Forecast: 2017 data right on forecast for all, except CCl4 fell less than expected. This year's CCl4 forecast revised slightly upward.
Oct2020 Update: All trace GHG pretty well on track ok for 2019 and 2020; minor adjustments made to forecast model.
Atmospheric SF6

atmospheric SF6 gas
Due to its chemical stability, high dielectric strength; and high thermal conductivity, SF6 is primarily used by the electrical industry as a gaseous dielectric medium. Other uses range from employment an inert gas during magnesium casting, use as a tracer gas and SF6 has even ben employed as a filler between panes of multiple pane windows. Environmentally, SF6 is a potent greenhouse gas some 24000 times as potent as CO2, but SF6 is not viewed as ozone depleting in the stratosphere. Due to its chemical stability, SF6 has extremely long residence times in both troposphere and stratosphere. Although SF6, has been acknowledged as a potent GHG, nonetheless due to its commercial importance, it remains only lightly regulated. Certainly users are encouraged to minimize leakage, and to recover and reuse SF6 from old units as they are replaced. As an excuse it is sometimes mentioned that it is present in the atmosphere only in low ppt levels. However my charts indicate atmospheric levels are rising very rapidly.
May 2018 Update: 2017 levels still rising right on last year's forecast.
Sep27/19 Update: 2018 & 2019 data right on previous forecast.
Oct2/20:2020 data right on previous forecasts.
Note that atmospheric concentrations of SF6 have more than doubled since 2000.
May 2018 Update: 2017 levels still rising right on last year's forecast.
Sep27/19 Update: 2018 & 2019 data right on previous forecast.
Oct2/20:2020 data right on previous forecasts.
Note that atmospheric concentrations of SF6 have more than doubled since 2000.
TRACE ATMOSPHERIC GREENHOUSE GASES THAT DEPLETE THE OZONE LAYER
ATMOSPHERIC CFC-11, CFC-12 and CFC-113

atmospheric CFC-11 gas
atmospheric CFC-12 gas

atmospheric CFC-113 gas
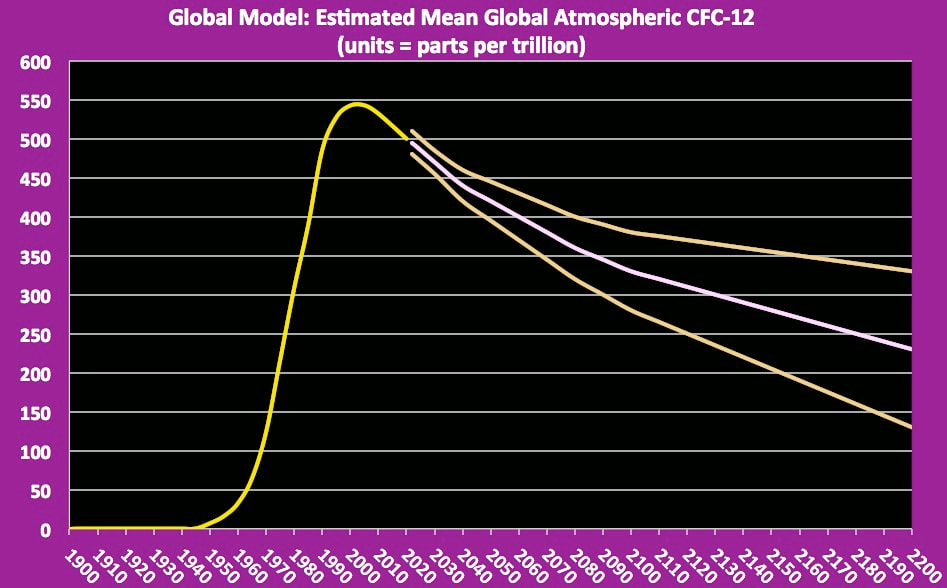
The fluorocarbons trichlorofluoromethane, dichlorodifluoromethane and trichlorotrifluoroethane are artificial gases formerly widely employed as refrigerants, as aerosol propellants and sometimes as degreasing solvents. Their common names are CFC-11, CFC-12 and CFC-113 respectively; also they are well known by their trade names Freon-11, Freon-12 and Freon-113. These CFCs are highly stable and therefore persist in the troposphere for many years. Unfortunately CFC-11, CFC-12 and CFC-113 all are very potent greenhouse gases. More importantly, once CFC-11, CFC-12 or CFC-113 molecules have diffused into the stratosphere, each single molecule can degrade many tens of thousands of ozone molecules by photochemical reaction. Such serious depletion of stratospheric ozone led to the so-called ozone hole over Antarctica. Consequential international concern led to international agreement (sometimes called the Montreal Protocol) in 1987 to begin phasing out production of CFC's, and their production is now greatly curtailed. Because these CFCs are so stable in the troposphere, atmospheric concentrations of these gases will slowly fall through the 21st century.
Increasingly fluorocarbons have been replaced by hydrochlorofluorocarbons (HCFCs) and by hydrofluorocarbons (HFCs) as refrigerants, as aerosol propellants and as solvents. Both HCFCs and HFCs are potent greenhouse gases but they are expected to be less damaging to the ozone layer. Touch wood! To date I haven't included plots for any HCFCs or HFCs since there is only just over 20 years of data. However I do note that HCFC-22 already exceeds 100 ppt and continues an upward trend.
MAY2018 UPDATE: CFC-11, CFC-12 AND CFC-113 all three declined in 2017 right on model forecast, except CFC-11 not as much as forecast.
Sep30/19: CFC-11 decreased less in 2018 and 209 to date than forecast in 2016 so forecast model adjusted; CFC-12 and CFC-113 decreased right on previous forecasts. Forecast model for all 3 extended to year 2200.
Oct2020 Update: Minor revisions to model. Overall on forecast ok.
Atmospheric carbontetrachloride CCl4

atmospheric carbon tetrachloride gas
Carbon tetrachloride is a volatile liquid now recognized as a likely carcinogen and poison. Before these health hazards were recognized CH4 was widely used as a solvent, as a dry cleaning agent, refrigerant, and even for fire-fighting. Presently carbon tetrachloride remains commercially important both as a solvent and as a chemical feedstock towards making other substances. Environmentally, CCl4 is both a potent greenhouse gas in the troposphere and a potent ozone depleting gas in the stratosphere. It is reported to be about 1400 times as potent a GHG as CO2. Since CCl4 is ozone depleting, production and use is regulated per terms of the Montreal Protocol. It is encouraging that my chart shows atmospheric levels of CH4 have begun to fall.
Sep26/19 Update: 2018 & early 2019 data right on last year's forecast ok.
Oct3/20 Update: 2020 continues on forecast; model updated.
Sep26/19 Update: 2018 & early 2019 data right on last year's forecast ok.
Oct3/20 Update: 2020 continues on forecast; model updated.
Log-scale Chart of 8 Often Discussed greenhouse Gases

8 greenhouse atmospheric gases
Discussions of greenhouse gases often discuss the following 8 gases: Carbon dioxide, methane, nitrous oxide, sulfur hexafluoride, carbon tetrachloride and CF-11, CF-12 and CF-113. Most these gases also are potent ozone depleters in the stratosphere, though some question about SF6. I previously published individual charts for each gas, and those individual charts included forecast uncertainty estimates.
This chart includes both smoothed data estimates plus modelled forecasts but with uncertainty lines omitted since they would have cluttered the chart. All gases are here reported as units ppt, but a log scale was needed to cover the huge range of measurement concentrations from ppm, to ppb to ppt. Looking at the chart it is clear to see that 4 gases now are falling in concentration, and 4 are rising in concentration. The 4 decreasing gases all have been regulated per the Montreal Protocol, and are proof governments can successfully take action towards fixing global problems. I remain optimistic the Paris conference can get us started towards lowering all 8 gases. But do worry this is wishful thinking.
In summary, carbon dioxide is by far the most dominant greenhouse gas in terms of atmospheric concentration, followed by methane and by nitrous oxide. The trace gases are orders of magnitude lower in concentration, though the rapid increase in sulphur hexafluoride can be seen.
May 2018 Update: All 3 main greenhouse gases still rising; of trace GHG SF6 continues to rise but other trace gases continue to decrease. Carbon dioxide remains the dominant GHG concentration-wise.
Oct 2019 & Oct 2020 Updates: ditto

8 greenhouse atmospheric gases adjusted for relative warming impact
This chart shows each of the 8 atmospheric gases multiplied by GHG efficiency factors (i.e. potency), so all are reported with units of equivalent CO2. Note that CO2 remains the dominant GHG, but nitrous oxide has replaced methane as the second dominant gas, and methane has fallen to third most dominant. Overall the trace gases are minor players in spite of high GHG efficiency. Note long term increase in impact and forecast potential impact of SF6.
Oct 2020 Update: Carbon dioxide remains the do0minant greenhouse gas.
Factors used in model: CO2 1; CH4 30; N2O 300; CFC's 11000; SF6 23000; CCl4 1400.
Oct 2020 Update: Carbon dioxide remains the do0minant greenhouse gas.
Factors used in model: CO2 1; CH4 30; N2O 300; CFC's 11000; SF6 23000; CCl4 1400.

relative warming impact of 8 greenhouse gases
Similar chart to the previous one, except the results have been totalled for the 8 gases each date-range, and then each value expressed as a percent of this total. Clearly CO2 remains the dominant gas at about 70% of warming impact, and nitrous oxide the second dominant at between under 20 percent, and methane third at about 10%. The 5 trace GHG charted have relatively insignificant impact. (Note that the highly variable GHGs water vapour and ozone have been excluded from this discussion. Also excluded are a number of other trace gases.)
Feb 2017 Update: Not only is carbon dioxide the dominant greenhouse gas, but it is rising so much faster than methane and nitrous oxide that both appear & are forecast to be having a falling impact of global warning.
May 2018 Update: Above pattern continued through 2017.
Oct2019 Update: Certainly CO2 remains the dominant GHG. Also its impact again continues to increase faster than that for other GHG.
Oct2020: Same result;ts after 2019 and 2020 data added.
