Agriculture - meat Production

world production of meat & fish
|

world production per person of meat & fish
|
These two charts show the world's annual production of beef, pork, sheep & goat, poultry, wild fish and farmed fish. The left-hand chart shows total annual production for each, and the right-hand chart shows that same production divided by the world population. The total annual production for all six categories of meat has greatly increased from 1960 to present. My forecast model suggests poultry, pork and farmed fish will continue to show strong growth in future decades through 2100, but production of beef, mutton and wild fish will increase more slowly.
The right-hand chart gives a different picture. On a per person basis, production of poultry, pork and farmed fish has significantly increased since 1960, but per person production of beef and mutton has remained flat. Production of pork seems to have recently plateaued. Per person catch of wild fish initially rose since 1960 but since but recently has begun to decline. My forecast is that per person production of poultry and farmed fish will all continue strong increase, pork may remain stable or rise, sheep & goat will show slight increase, beef a slight decrease, and wild fish a significant decrease per person.
Please recall each forecast comes with a large uncertainty. To keep things simple, I have not included the uncertainty ranges on these charts, but please do see the individual charts to view that uncertainty.
In summary, we have greatly increased our production of meat since 1960 and I can confidently predict we should have enough meat to feed the increased population of 2200. Unless climate change derails food production.
Apr2018 Update: Major change from last year is lowered increasing forecast production for pork.
Sep6/19: Update: Last year production right on forecast for all meat; annual production divided by world population also no surprises, except error for sheep & goat corrected. Forecasts extended to year 2200.
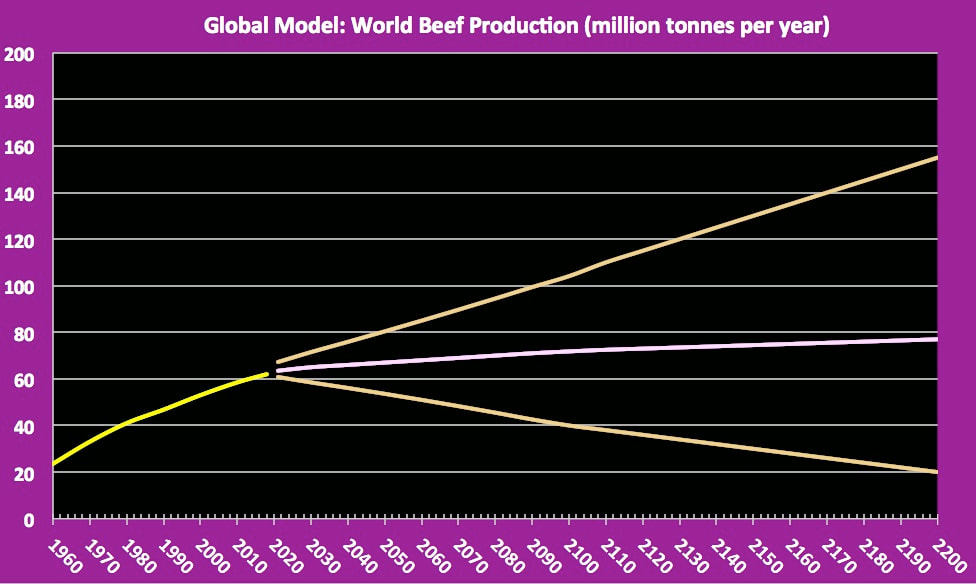
World production of Beef
world production of beef has slowed rate of increase
|

world production of beef per person has fallen to 1960s levels
|
I have prepared two charts showing the world's supply of beef. The left-hand chart shows the estimated annual production of beef expressed as million metric tonnes of beef per calendar year. The right-hand chart shows the same beef production but divided by the world's population to show the annual supply per person expressed as kg per person per year. As usual for my charts, I have plotted moving averages so as to highlight the trend lines by reducing annual variation noise.
The yellow line in each chart shows production smoothed to show the dominant trend. The left chart shows that the world supply of beef has nearly tripled since 1960. However the right chart shows that the amount of beef available per person has decreased since about 1980 to levels similar to those of 1960.
The pink line in each chart represents my forecast as to most likely beef supply over the coming decades to 2200. That forecast is that the overall beef production likely will continue to increase through to 2200. But beef production on a per person is forecast to continue to lessen very slowly.
However all forecasts have large uncertainty. The orange lines in each of the charts reflect the uncertainty range of my forecast model. These orange lines in the left-hand chart show that by 2200 we might produce a huge amount of beef, or alternatively we might produce much less beef than at present. The orange lines in the right-hand chart reflect show an optimistic forecast of a much increased supply of beef per person, and a pessimistic forecast of much less beef per person. The optimistic forecast requires both an increase in beef production plus a decrease in world population -- well don't hold your breath!
Summary of forecast: global beef supply likely will continue to increase, but per person supply of beef likely will continue to slowly decrease.
2017 Update: Slower increase in production while human population continues to increase, of course results in less annual supply of beef per person. The forecast estimates for beef production and for beef per person supply were both revised downward from last year's forecasts.
2018 Update: 2017 results right on forecast. Note that zero increase in total beef production lies well within the uncertainty distribution so remains a viable forecast. And to answer a reader's question, yes beef includes veal.
2019 Update: 2018 results right on previous forecast. Note that new forecast extended to 2200 and also upper per person uncertainty lowered.
Sustainability of Beef Production
Cattle ranching often has had significant impact upon local wildlife. Think deforestation in Brazil - see WWF article. Also see article describing first steps towards rectifying the Brazil problem. Elsewhere sustainability issues often include erosion and degradation of watersheds. Let not forget feedlots and abattoirs. For many ranchers maintaining sustainability seems unimportant when compared to daily problems of maintaining profitability, minimizing predation, coping with severe weather or resisting pressure to convert their grazing lands to croplands. Nonetheless some ranchers consider themselves stewards to their lands, and are finding good profitability from harmonizing cattle production with programs of long term sustainable ecosystem management. To this regard, WWF has reported positive results in working with ranchers of the Northern Great Plains of Canada and the USA.
World Production of farmed fish

world production of farmed fish
|

world production of farmed fish per person
|
Continuing my examination of past & future world food supplies, I next examine the production of farmed fish (aquaculture). A reminder that for both wild and farmed fish, shellfish species are included and mammals are excluded.
The left chart shows total annual production of farmed fish, and the right chart shows that same production divided by the world population. The total production of farmed fish (yellow line) has increased substantially since 1960, and my forecast (pink line) shows further production increase seems likely to continue in future decades..
Dividing the world farmed fish production by the world population gives a similar picture. The per person annual catch increased significantly since 1960, and this increase seems likely to continue to increase in future decades but a century from now our population increase might well equal or even exceed production of farmed fish. Orange lines show uncertainty in forecast predictions.
2017 Update: Production of farmed fish & shellfish increased over 5% in past year.
Apr2018 Update: Record high production of farmed fish & shellfish continues
June2019 Update: Extension of forecast to year 2200 shows total world production of farmed fish & shellfish to continue in future decades, but possible plateauing of per person fish production.
Summary: World supply of farmed fish will continue to greatly exceed year 2000 levels.
SUSTAINABILITY OF farmed fish PRODUCTION
Farming of fish can be fairly sustainable, especially for smaller scale operations such as adding fish culture to a farm pond or to a hydroponics operation. However, fish farming can be non-sustainable if operators over-consume water from surface waters or groundwaters, if they release polluted water to local water bodies, if excessive hormones and antibiotics are utilized, if fish themselves or their parasites or diseases escape to local environment, or if fish wastes degrade nearby habitats. Sustainable operations are possible When done right, aquaculture can be sustainable while same time replacing wild fish on our dinner plates. Sustainable practices include recirculating systems involving aquaponics, rigorous water quality monitoring, raising herbivorous species (re fish feed), control of disease and by other than antibiotics, third party independent audits of operations and impacts to nearby habitats, and finally clear traceability from farm to store. A number of agencies have published articles towards making fish farming sustainable, for example World Resources Institute.
World production of Sheep & goat meat

world production sheep & goat meat
|

world production sheep & goat meat per person
|
These two charts show the world's supply of sheep & goat meat. The left chart shows the estimated annual production expressed as million metric tonnes of meat per calendar year. The right chart shows the same sheep & goat meat production but divided by the world's population to show the annual supply per person expressed as kg per person per year.
The yellow line in each chart shows production smoothed to show the dominant trend. The left chart shows that the world supply of sheep & goat meat has roughly tripled since 1960. The right chart shows only a small increase on a per person basis.
The pink line in each chart represents my forecast as to most likely production of sheep & goat meat over the coming decades to 2200. That forecast is that the overall production likely will continue to increase through to 2200. nonetheless, production per person is forecast to remain fairly constant.
The orange lines in each of the charts reflect the extreme uncertainty ranges of my forecast model. These orange lines in the left chart shows that by 2200 we might produce a huge amount of sheep & goat meat, or alternatively we might produce no more than at present. The orange lines in the righthand chart show an optimistic forecast of a much increased supply per person, and a pessimistic forecast of less per person. The optimistic forecast requires both a maximum increase in sheep & goat meat production plus a maximum decrease in world population, and vice versa for the pessimistic forecast.
2017 Update: 2016 production of sheep & goat meat increased some 2% from 2015 to 2016, faster than I had forecast. My forecast model has been revised upward. Clearly we are increasing production faster than our population is growing, increasing supply available per person.
Apr2018 Update: 2017 showed a record production, and it seems more to come. Last year's revised forecast still right on track ok.
Aug2019 Update: 2018 production right on forecast. However, last year's per person model was discarded as erroneous, and and the model replaced from scratch. My apologies for not catching this sooner.
Summary of forecast: global sheep & goat production likely will continue to increase total production but level per person.
SUSTAINABILITY OF Sheep & Goat PRODUCTION
Pasture-based sheep & goat farming is fairly sustainable provided the animals are regularly moved to fresh pastures. Both sheep and goats can be conveniently added to existing farms since they require minimal care and shelter, are easy to handle, and are climate tolerant. For beginning farmers they are relatively inexpensive and easy care. For established farms they broaden the biological diversity and add to the economic bottom line. And of course wool for sheep is produced as well as mutton. Some operations have increased production through intensive pasture grazing or feedlots. Such intensive production is much less sustainable.
world production of pork

world production of pork
|

world production of pork per person
|
These two charts show the world's supply of pork. The lefthand chart shows the estimated annual production of pork expressed as million metric tonnes of pork per calendar year. The righthand chart shows the same pork supply but divided by the world's population to show the annual supply per person expressed as kg per person per year.
The yellow line in each chart shows production smoothed to show the dominant trend. The left chart shows that the world supply of pork has increased some 6-fold since 1960. However, the yellow line on right chart shows that the amount of pork available per person has roughly doubled since 1960.
The pink line in each chart represents my forecast as to most likely pork supply over the coming decades to 2200. That forecast is that the overall pork supply likely will continue to increase through to 2200. Pork supply per person also is forecast to continue to remain approximately constant at 2010 levels.
However all forecasts have large uncertainty. The orange lines in each of the charts reflect the uncertainty range of my forecast model. These orange lines in the lefthand chart shows that by 2200 we might produce a huge amount of pork, or alternatively we might produce less pork than at present (though still more than in 1960). The orange lines in the righthand chart reflect show an optimistic forecast of a much increased supply of pork per person, and a pessimistic forecast of less pork per person. The optimistic forecast requires both a maximum increase in pork production plus a maximum decrease in world population, and vice versa for the pessimistic forecast.
2017 Update: Changed from smoothed to non-smoothed estimates for lefthand chart. Post 1970 increase is surprisingly linear. The supply of pork per person (righthand chart) shows small decrease for 2016, but still within forecast model.
2018 Update: Record high production for 2017 lower than previous forecasts. Therefore slope of forecast line decresed in global model. Also zero increase per person well within the uncertainty distribution.
2019 Update: Strong increase in world pork production continues. Positive forecast extended to 2200.
Summary of forecast: global pork supply likely will continue to increase, and the per person supply of pork likely will remain similar to present.
SUSTAINABILITY OF Pork PRODUCTION
Non-sustainable pork production involves slatted floor indoor intensive production with heavy investment is buildings, energy, water, food, pesticides, antibiotics and hormones. Internet search shows a large selection of articles how to make pork production more sustainable. Not surprisingly more sustainable approaches involves less indoors factory farming, more animal time in outdoor pastures, very limited use of pesticides or antibiotics, and no use of hormones. Disease remains a concern.
world Production of poultry meat

world production of poultry meat
|

world production of poutry meat per person
|
These two charts show the world's annual production of poultry meat. The left chart shows the estimated annual production of poultry met expressed as million metric tonnes per calendar year. The right chart shows the same poultry production but divided by the world's population to show the annual supply per person expressed as kg per person per year.
The yellow line in each chart shows production smoothed to show the dominant trend. The left chart shows that the world supply of poultry has greatly increased since 1960. Correspondingly, the yellow line on right chart shows that the amount of poultry available per person also has increased since 1960. Clearly poultry supply is growing even faster than the human population.
The pink line in each chart represents my forecast as to most likely poultry supply over the coming decades to 2100. That forecast is that the overall poultry supply likely will continue to increase rapidly through to 2100. Correspondingly, poultry supply per person also is forecast to increase. The orange lines in each of the charts reflect the uncertainty ranges to my forecasts. These orange lines in the left chart shows that by 2100 we might produce a huge amount of poultry, and encouragingly, even the most pessimistic forecast suggests levels of poultry supply well above that of present day .
The orange lines in the right chart show an optimistic forecast of a much increased supply of mutton per person, and a pessimistic forecast of slightly above present and well above 1960. Again, I find these forecasts very encouraging.
Summary of forecast: global poultry meat supply likely will continue present rapid increase, and the per person supply of poultry also seems very likely to increase.
2017 Update: Increasing production of poultry meat continues: 2016 production exceeded 2015 production by over 1%. The per person production rate also continues year to year increase.
Apr2018 Update: Strong increase in production continues as forecast.
Sep4/19: Strong increase in production of poultry meat continues.
SUSTAINABILITY OF poultry PRODUCTION
Sustainable poultry production seeks to achieve long-term good health of the poultry, the farm land, the farm economics and of the farm family. By in large caged production is not sustainable, 'free run' production within open-concept barns (but without access to outdoors) is somewhat sustainable, and 'free range' production with access to outdoors pastures is most sustainable. For existing farms, pastured poultry require minimal initial expenditure and diversify farm operation, thereby improving overall farm sustainability. However poultry do require adequate housing for protection against weather and predators. Benefits include both enhancing soil fertility plus control of weeds and insects as the birds forage. Note the ongoing concern as to impacts of outbreaks of avian influenza to flocks and farmers both.
world catch of wild fish

world annual catch of wild fish
|

world annual catch of wild fish per person
|
These two charts show the world's annual catch of wild fish, including shellfish. The left chart shows the estimated annual catch of wild fish expressed as million metric tonnes of fish per calendar year. The right chart shows the same wild fish catch but divided by the world's population to show the annual catch per person expressed as kg per person per year.
The yellow line in each chart shows production smoothed to show the dominant trend. The left chart shows that the world supply of wild fish has risen some 4-fold since 1960 and showed a sudden increase recent years after a several decade plateau. Similarly, the yellow line on right chart shows that the amount of wild fish available per person remains significantly higher than in 1960.
The pink line in each chart represents my forecast as to most likely wild fish catch or supply over the coming decades to 2200. That forecast is that the overall supply of wild fish likely will remain fairly stable through to 2200. Nonetheless wild fish supply per person is forecast to continue its present decline.
The orange lines in each of the charts reflect the extreme uncertainty ranges of my forecast model. These orange lines in the left chart shows that by 2200 we might increase the catch of wild fish, or alternatively the catch might decrease substantially.
The orange lines in the right-hand chart show an optimistic forecast of a much increased supply of wild fish per person, and a pessimistic forecast of less wild fish per person. The optimistic forecast requires both a maximum increase in fish catch production plus a maximum decrease in world population, and vice versa for the pessimistic forecast.
2017 Update: It appears the recent surge in wild fish & shellfish catch continues.
Apr2018 Update: Data updated to include 2017. I changed from annual estimates to smoothed data. Even so the recent surge in fish capture remains obvious.
May2019 Update: Updated charts show same pattern as last year; forecast model extended to 2200.
Summary of forecast: It seems significant effort is being made to maintain the present wild fish supply in spite of world fisheries being already over-fished past capacity. The supply per person seems surprisingly stable, but a long term decline seems obviously underway It is important to note that these figures only reflect officially reported catches of wild fish & shellfish -- it seems very likely that the unreported catch is quite large. Also unreported is the unknown but likely significant fish killings by so called ghost nets.
Sustainability of wild fish harvest
A sustainably harvested fishery should maintain or enhance species diversity, age diversity, and genetic diversity of the wild fishery along with protecting the local aquatic habitat. Conversely over-exploitation of a fishery all too soon will result in loss of diversity, loss of resilience to environmental stresses, and eventually to collapse of the fishery and to non-economic viability too. A recent FAO report indicates just under 70% of the world's fisheries are either fully exploited or over-exploited. Wikipedia describes the necessary steps to avoid over-exploitation of a wild fisheries. Unfortunately many of the world's fisheries have been over-harvested. Intensive fishing often results in accidental by-catch of non-target fish species, plus non-fish species such as turtles and porpoises. Also bottom trawling can seriously damage the seabed. Exacerbating matters there reportedly is signifiant black-market harvesting of fish.
Traditional and small- scale hook & line methods of fishing reportedly are much more sustainable than modern indistrial scale fishing methods. Nonetheless it is impractical to expect nations will return traditional fishing. However it is practical to expect nations to ensure vulnerable fisheries are restored, protected and enhanced. I trust it is also practical to expect individuals will ensure they do not consume endangered species. Wikipedia has published a useful species list to this regard.
Addendum: I was impressed at a recent visit to Capetown, South Africa to see several restaurants included line-caught fish on their menus.
Comparison of annual farmed fish production to wild fish catch

comparison of farmed fish production to wild fish catch
|

comparison on per person basis of farmed fish production to wild fish catch
|
This pair of charts added for convenient comparison of farmed fish to wild fish caught. A reminder fish includes shellfish but excludes mammals, birds, reptiles or turtles. Note that we can expect farmed fish production soon to exceed wild fish harvest and in future decades to greatly exceed wild harvest.
Update Jan.2017: Farmed fished production still closing in on wild fish catch, and is forecast to exceed wild fish catch within several years.
Update Apr21/18: Farmed fish production just short of exceeding wild harvest.
Update June2019: ditto
Update Jan.2017: Farmed fished production still closing in on wild fish catch, and is forecast to exceed wild fish catch within several years.
Update Apr21/18: Farmed fish production just short of exceeding wild harvest.
Update June2019: ditto
