World food supply - Crops

world annual production of major food crops
|

world annual production of major food crops per person
|
I have defined Food Crops as Cocoa, Maize (Corn), Palm Oil, Plantains, Pulses, Rice, Sugar and Wheat. All eight food crops have shown strong increased production since 1960, the base year for my charts. Only sugar showed a decrease from 1960 but that soon reversed to an increasing trend. The left-hand charts show the production divided by the world population of people. Interestingly my model forecasts most crops seem likely to stabilize at fairlly constant per-person levels, except wheat which clearly already has begun a per person decline.
A reminder that my model uses smooths our statistical variations to emphasize trend lines. Also these multiple food charts omit forecast uncertainty estimates. I think this simplification keeps things more visually understandable. However, there is information lost with elimination of the annual variance. Especially note that climate change impacts likely will be seen in enhanced annual variations before coming noticeable in the smoothed trend lines.
2018 Update: 2017 data consistent with previous forecasts. Markers added to 3 trend & forecast lines to improve visual id.
2019 Update: This year I decided to plot 'sugar' rather than 'sugarcane'. This drops this category from first to fourth most produced. Also I extended the forecast model to 2200.
Cocoa Production

world cocoa production
|
world cocoa production per person
|
Cocoa originates from cocoa beans of the cocoa tree, which grow in hot and humid tropical areas. Cocoa beans are high in cocoa butter, from which chocolate is made. A majority of cocoa remains produced by small family farms, typically located West Africa, SE Asia or Latin America and often depending on cocoa for their income. Since cocoa farming tends to be in poor third world countries, cocoa farming communities tend to face many social-economic issues including poverty, poor education, limited literacy, health problems including malaria and HIV/AIDS. Cocoa production is quite labour intensive, requiring hard manual work. Unfortunately this can lead to child labour and even credible reports of slave labour. Reportedly the World Cocoa Foundation is partnering with industry and famers towards improving sustainability and economics of cocoa farming, as well as improvements to eduction and health.
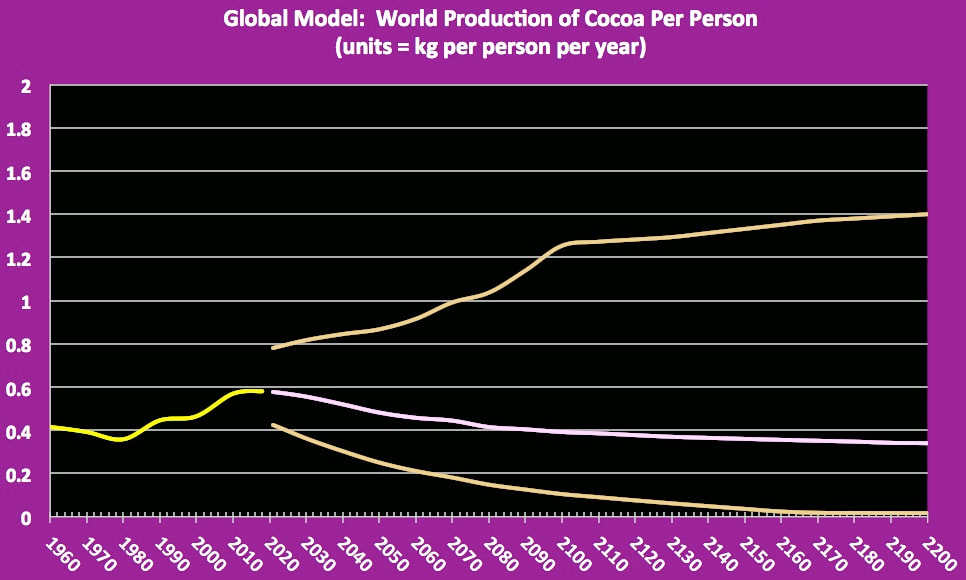
My forecast charts show total annual world cocoa production has increased significantly since 1960, and but recently production production seems to slowed. On a per person basis, production showed a similar increase from 1960 through about 2010, but then has begun to fall. However, we do all love our chocolate, so I quite expect consumption & demand to continue to grow -- i.e. higher prices coming!
Apr/19 Update: Forecast for total cocoa production more optimistic than a year ago; forecast for per person production remains pessimistic.
Sustainability of Cocoa Production
Sustainability issues include deforestation, social-economic issues, heavy use of pesticides including fungicides. Poverty and poor eduction tend to desensitize cocoa communities to diversity losses of deforestation.
Addendum: There has been some suggestion that climate change is expected negatively impact some cocoa growing areas.
Addendum: There has been some suggestion that climate change is expected negatively impact some cocoa growing areas.
world maize (corn) production

world annual production of maize
|
world production of maize divided by world population
|
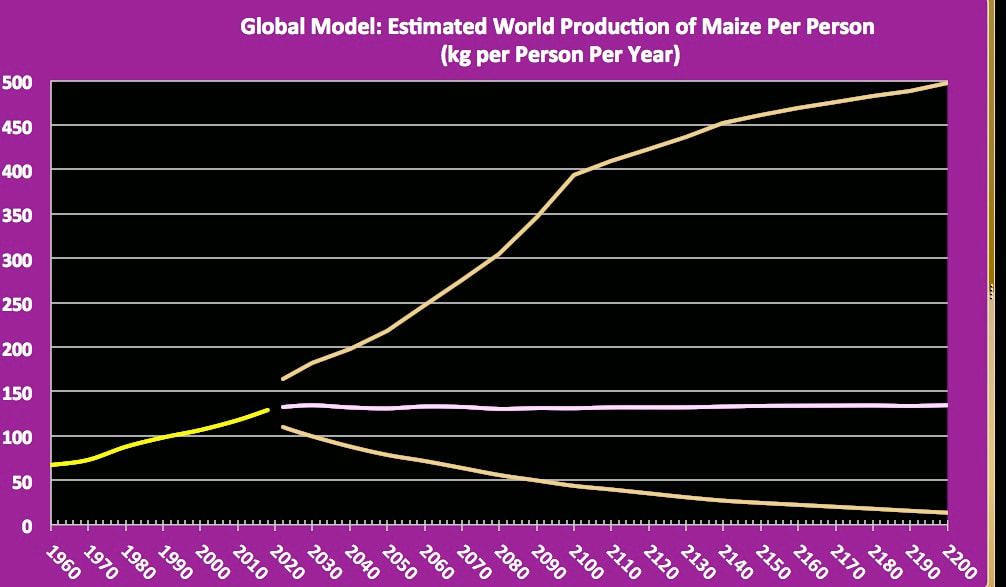
Next I examine maize (corn) production. Same procedure & style as defined for previous charts. Total annual production of maize (left chart) shows that total annual production has increased 5-fold since 1960. My forecast is that maize production is very likely to continue to increase significantly, provided sufficient water is available. A similar increasing trend is seen when this production is expressed on a per person basis, but our rapidly inceasing population flattens the per person forecast. Of course maize is used not just for human consumption but has a number of other uses including animal feed and alcohol production. I expect water deficiencies and climate change impacts may restrict future increases.
2019 Update: World production of maize forecast revised slightly upward . Nonetheless the increased forecast in human population plateaued per person forecast. Both charts had forecasts extended to 2200.
2019 Update: World production of maize forecast revised slightly upward . Nonetheless the increased forecast in human population plateaued per person forecast. Both charts had forecasts extended to 2200.
Sustainability of maize cultivation
Maize (corn) is not an easily sustainable crop since it is both water-hungry and depletes soil nutrients. Yet it is an essential crop for number of countries, and therefore considerable economic pressure is brought on farmers to increase production, whether by irrigation, by soil conditioning, by fertilization, by use of pesticides and herbicides, and also by practices such as expansion onto lands having marginal soil quality or fragile ecosystems. All such practices can impact sustainability, especially when done poorly. Of major concern are loss of vulnerable ecosystems, soil degradation, erosion of soil sediments during bare ground after tillage, and depletion of shrinking aquifers. Also nutrient loss from mis-timed or excessive fertilization may degrade downstream aquatic environments. There seems significant scope to encourage sustainability through recognition which properties are marginally suitable for maize cultivation, plus education as to land preparation, crop scheduling, choice of maize varieties, proper fertilization techniques, improved control of weeds and pests, and preferred irrigation practices. There is some likihood as to possible serious impacts to maize production as impacts from climate change come more severe in future decades.
World production of palm oil

world production of palm oil
|

world production of palm oil per person
|
Produced primarily in Indonesia and Malaysia, palm oil has become the most produced vegetable oil world-wide. It is popular because it has good cooking properties, is a natural preservative, and is less costly than other vegetable oils. Reportedly palm oil is less costly because it takes much less land to produce than other oils but also because of rapid expansion of the industry.
As usual for my charts of agricultural crops, I have produced two charts. The left chart shows annual production of palm oil since 1960, and the right chart shows that same production divided by the world population to give a per-person annual production. The production chart shows production has increased some 35 fold since 1960; production is forecast to continue to increase every decade to 2200. The per-person chart shows production increased much faster than world population from 1960 to about 2010, and continues to somewhat exceed growth in human population.
Update April 2019: Forecast model tweaked upward & also extended to year 2200.
SUSTAINABILITY OF Palm Oil CULTIVATION
With regard to sustainability, palm oil cultivation has caused very signifiant deforestation with severe loss of diversity as pristine forests are transformed into palm oil plantations. There has been some socio-economic disruptions as local people have been displaced. Reportedly some palm oil producers are fast-tracking production profit with no regard to sustainability. Problems include both soil erosion and smoke pollution associated with land clearing, plus long-term negative impacts re climate change as the carbon sinks of peatland forests are drained. On a positive note, a growing number of producers are moving towards more sustainable practices, by seeking certification of compliance with the standards set by the Roundtable of Sustainable Palm Oil.
world production of plantains

world annual production of plantains
|
world per person production of plantains
|
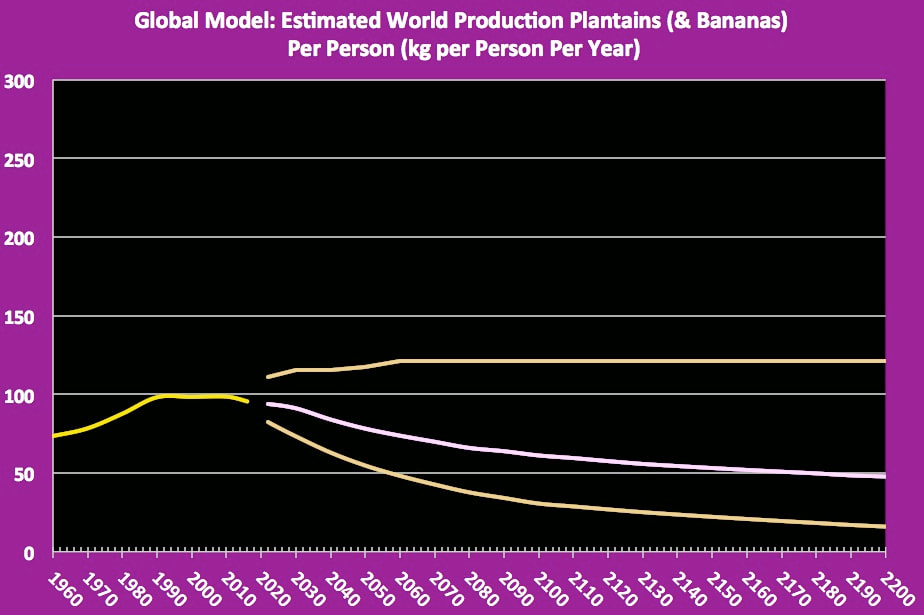
Next I look at the statistics for plantains, which include bananas. Total annual production of plantains (left chart) has roughly increased 5 fold since 1960, and my forecast line shows production seems likely to continue to increase through 2200. Total annual production on a per-person basis (right chart) shows a some increase since 1960, but a decreasing forecast which already is underway.
Feb2017 Update: Charts updated -- results consistent with last year's forecasts.
Apr15/18: Again results consistent with last year's forecasts.
Mar17/19: Total production remains consistent with last year's forecast but production divided by world population forecasts lower than previous forecast models. Also both charts extended to 2200.
Sustainability of Plantain cultivation
Cultivation of bananas and other plantains ranges from low-yielding cultivation by small scale farmers to intensive mono-cropping with intensive use of fertilizers and pesticides by corporate farmers. Research groups such as CIRAD appear to be working towards enhancing socio-economics by increasing cropping intensity but in a more sustainable and environmental friendly manner. Possible improvements include use of green manure to reduce fertilizer, use of pest-resilient varieties to reduce use pesticides and increase production, and widening the genetic basis of the preferred export bananas. I expect farmers find improved socio-economics much higher priority than sustainability.
world production of pulses (grain legumes)

world production of pulses
|

world per person production of pulses
|
Continuing my examination whether our growing population will have sufficient food in future decades, I next take a look at world production of pulses. A reminder that pulses are dried legume seeds, such as beans, peas and lentils. Sometimes they are referred to as 'grain legumes'.
The left chart shows total annual production of pulses, and the right chart shows that same production divided by the world population. The total production of pulses (yellow line) has increased substantially since 1960, and my forecast (pink line) shows further production increase seems likely to continue in future decades. Orange lines show uncertainty in forecast predictions. Nonetheless production of pulses seems to be lagging behind that for other crops, and has not even doubled since 1960. My reading suggests farmers prefer other more profitable crops if given the opportunity to switch.
However, dividing the world production of pulses by the world population gives a different picture. Production of pulses on a per person basis has fallen since 1960, and this production seems likely to continue slowly to decline in future decades, as population of people grows more rapidly that increase in production of pulses.
Feb2017 Update: Results consistent with last year's charts. Production seems to have reached a plateau this decade but I expect this will be temporary. Production of pulses continues to lag behind other crops and on a per person basis continues a long-term decrease.
Apr2018 Update: Record high production of pulses last year but production per person continues to fall.
Mar18/19: Production forecast revised upward but production per person forecast lowed somewhat. Both forecasts extended to 2200.
Sustainability of Producing pulses
Cultivation of pulses is known to enhance soil quality by fixing nitrogen and by encouraging diverse populations of soil microbes. Including pulses in crop rotation programs of soil management reportedly enhances both production and quality of other crops. Importantly, pulses offer people an important source of protein, but at the same time have both a low carbon footprint and a low water footprint relative to other sources of protein. Many pulses crops thrive in semi-arid conditions. Also pulses are more tolerant to droughts than many other crops.
World Production of rice

world production of rice
|

world per person production of rice
|
Next I take a look at world production of rice. The left chart shows total annual production of rice, and the right chart shows that same production divided by the world population. The total annual production of rice (yellow line) has increased substantially since 1960, and my forecast (pink line) shows further production increases seem likely for future decades. Orange lines show uncertainty in forecast predictions. On a per-person basis, annual production of rice showed a significant a slow increase since 1960, but my forecast is that annual production per person seems likely to remain flat through 2100 followed by a slow decrease.
Feb2017 Update: Increased production continues both total and per person.
Apr2018 Update: Rice production remains high, 2017 production similar to that for 2016.
Mar2019 Update: Rice production continues to increase & forecast remains unchanged. However increase in human population has flattened rice production on a per person basis.
sustainability of rice production
Rice has been cultivated over ten thousand years -- see History. Traditional rain-fed or irrigated methods of rice production have been fairly sustainable for thousands of years. Unfortunately traditional sustainable rice cultivation often has been superseded by intensive rice monoculture involving year round production, limited diversity of rice varieties, inappropriate water use, heavy dependance ion pesticides and fertilizers, and intensive mechanization. Such intensive production tends to degrade soil, local biodiversity, and and long term productivity, i.e. sustainability is diminished. At the same time sustainability is additionally weakened by global climate change, poor maintenance of works, plus competition for water and for and land.
The Sustainable Rice Platform (SRP) is an international stakeholder partnership jointly convened by the United Nations Environmental Program and the International Rice Research Institute to promote adoption of sustainable best practices in rice.production while maintaining efficient production where possible.
The Sustainable Rice Platform (SRP) is an international stakeholder partnership jointly convened by the United Nations Environmental Program and the International Rice Research Institute to promote adoption of sustainable best practices in rice.production while maintaining efficient production where possible.
World Production of SugarCane

world production of sugar cane
|

world per person production of sugar cane
|
The left chart shows that annual production of sugarcane was flat 1960-90, but subsequently has increased more than doubled in recent decades. My forecast model shows production likely may continue to increase in future decades. The right chart shows that the per person annual production of sugarcane fell from 1960 to 1990, then returned to 1960 levels, but is forecast to decrease slowly through 2200. Sugarcane of course is an important source of sugar, but also of animal fodder, biofuel and bioplastics. Note the large uncertainty shown on both charts. Increased production very likely will be associated with increasing environmental impacts.
2017 Update: Trend & forecast continue on track. Use of smoothed data obscures recent weather impacts.
2018 Update: ditto.
2019 Update: Revised model greatly diminished forecast production for both charts. Note forecast extended to 2200.
2017 Update: Trend & forecast continue on track. Use of smoothed data obscures recent weather impacts.
2018 Update: ditto.
2019 Update: Revised model greatly diminished forecast production for both charts. Note forecast extended to 2200.
Sustainability of sugarcane cultivation
Sugarcane cultivation is facing a number of serious problems including disease, pests, soil degradation, use of agrochemicals and fertilizers, and large water consumption. Also as noted in a WWF report, sugarcane cultivation has impacted some environmentally sensitive areas. Thus there is some question as to the sustainability of growing sugar cane. In response the Sustainable Sugarcane Initiative (SSI) was initiated in India towards making sugar cane cultivation more sustainable. Worldwide, an increasing number of producers are seeking certification under BONSUCRO, or The Better Sugarcane Initiative, which is a non-profit initiative "dedicated to reducing the environmental and social impacts of sugarcane production." I would call this still early days towards solving the problems, but it is promising there are both practical manuals and some regulatory support. However one does worry about 'greenwash'.
World Sugar Production (Cane & Beet)

annual world production of sugar -- both cane and beet derived
|

annual world production of sugar divided by world popultion
|
The previous discussion of sugarcane production seemed incomplete without a look at sugar production itself. (Note however that these charts include sugar derived both from sugarcane and from sugar beets.) Interestingly the 1970's showed a decrease in overall sugar production followed by a recent upward surge. The forecast model suggests significant increases in sugar production to be expected.
The second chart shows world sugar production expressed on a per person basis. On the left of this chart decrease in production is emphasized by the increasing world population. To the right it is forecast that increased sugar production will likely grow similar to population increase, giving more or less flat per person production. Again a reminder that sugar is used for biofuels and other non-food products.
2019 Update: Unlike sugarcane, the sugar model was pretty well on target, just reuiring a small tweek. The per person forecast changed from smallrise to pretty well flat.
World wheat production

world production of wheat
|

world per person production of wheat
|
Annual production of wheat has more than tripled since 1960. However although production continues to increase, the rate of increase is slower than that for our human population. Therefore on a per person basis, wheat production reached a plateau for the past 3 decades but is forecast to slowly decrease in future decades.
Mar2/19: World production of wheat continues to increase but world population continues to increase even faster. Decline in per person production now visible to eye. Note forecast has been extended to 2200.
Mar2/19: World production of wheat continues to increase but world population continues to increase even faster. Decline in per person production now visible to eye. Note forecast has been extended to 2200.
sustainability of wheat cultivation
Conventional methods of wheat cultivation may often result in soil erosion and soil degradation. The USA experienced the soil erosion problem to great extreme as the Dustbowl of the Dirty Thirties. Soil erosion continues to threaten long term sustainability, but the problem has been somewhat masked by increased yields due to improved wheat varieties and other technological enhancements. On the long run, I would expect greater and greater effort will be required to maintain yields. Climate change likely will exacerbate the situation.
